Stags still splashing the cash on their stag weekends
17 Dec 2012

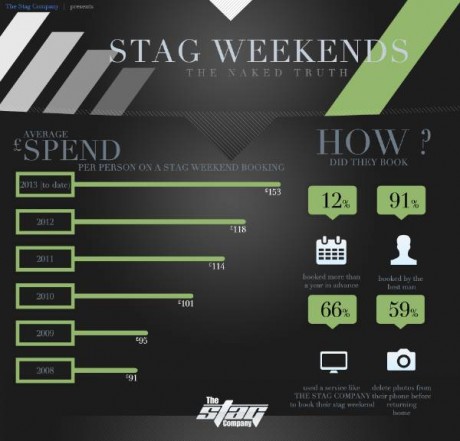
In the latest in our infographic series we're looking at the average spend that stags are making on their stag weekends.
Looking back as far as 2008 we can see the average that each person spends on a stag do has risen each year from 2008 to 2012, with 2013's projected spend being even more. While Britain has seen two recessions in recent years this hasn't affected the stag do trade, as more and more is spent on stag dos with each year, as stags begin to look for more from their stag do packages.
So if we are struggling financially then just why are we seeing this rise each year? Maybe it's because no matter what, people will always get married and as a result, people will always want to go on a stag or hen do!
It's also worth noting our other numbers on the infographic, including the one that a massive 91% of stag weekends booked through the Stag Company are done so by the best man of the groom to be. It's also perhaps a little unnerving to know that 59% of people on stag dos delete images from their cameras or phones before they return home. Tut tut, unless of course this 59% accounts for just badly taken photos, but we all know that is probably not the truth.
So, it would appear that what we can take away from this week's infographic is that no matter what state the world's economy is in, we will always somehow find a way to finance a stag weekend!
Stag dos
made easy
Experienced Event Planners
Tried & tested activities
Flexible payment options
Easy online booking
We're the original stag experts
Book a stag and invite friends to pay, all in one place!


.jpg)

